Multiple Choice
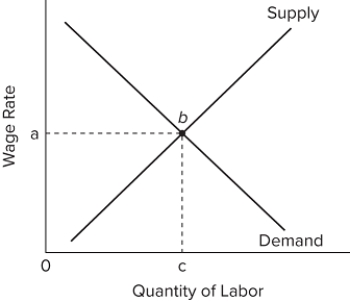 The graph represents the supply and demand for labor in a purely competitive market. The area 0 abc represents
A) total revenue of the firm.
B) total earnings of labor.
C) marginal revenue product of labor.
D) marginal labor cost.
Correct Answer:
Verified
Related Questions
Q141: Define minimum wage. What is the purpose
Q142: Explain the long-run relationship between real hourly
Q143: What are the economic effects of imposition
Unlock this Answer For Free Now!
View this answer and more for free by performing one of the following actions

Scan the QR code to install the App and get 2 free unlocks

Unlock quizzes for free by uploading documents