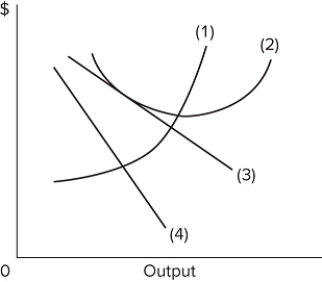
 Refer to the above graph of a representative firm in monopolistic competition. If curve (2) represents ATC and line (3) represents demand, then we can conclude that the industry
A) has positive economic profits.
B) is in long-run equilibrium.
C) will contract in the long run.
D) is not maximizing profits.
Correct Answer:
Verified
Q181: Answer the question on the basis of
Q182: Answer the question on the basis of
Q183: The graph depicts a monopolistically competitive firm.
Q184: Answer the question based on the demand
Q185: The graph depicts a monopolistically competitive firm.
Q187: The graph depicts a monopolistically competitive firm.
Q188: Answer the question based on the demand
Q189: If monopolistically competitive firms in an industry
Q190: Answer the question on the basis of
Q191: In monopolistic competition, a firm has a
Unlock this Answer For Free Now!
View this answer and more for free by performing one of the following actions

Scan the QR code to install the App and get 2 free unlocks

Unlock quizzes for free by uploading documents