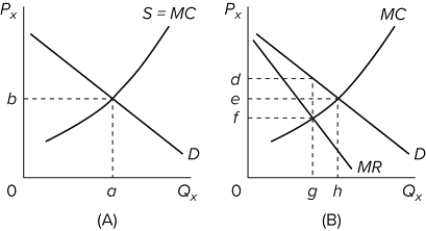
 Refer to the diagrams. Diagram (A) represents
A) equilibrium price and quantity in a purely competitive industry.
B) the pure monopoly model.
C) an industry in which there is productive efficiency but not allocative efficiency.
D) a single firm operating in a purely competitive industry.
Correct Answer:
Verified
Q268: Q269: Q270: Q271: Confronted with the same unit cost data, Q272: A single-price monopoly is economically inefficient because, Q274: A single-price pure monopoly is economically inefficient Q275: Q276: If a pure monopolist is producing more Q277: An important economic problem associated with pure Q278: Unlock this Answer For Free Now! View this answer and more for free by performing one of the following actions Scan the QR code to install the App and get 2 free unlocks Unlock quizzes for free by uploading documents![]()
![]()
![]()
A)only![]()
![]()

