Multiple Choice
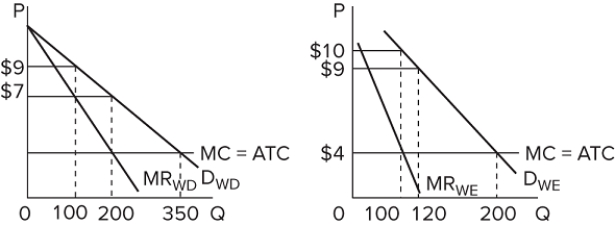 The graphs represent the demand for use of a local golf course for which there is no significant competition. (It has a local monopoly.) P denotes the price of a round of golf, and Q is the quantity of rounds "sold" each day. If the left graph represents the demand during weekdays and the right graph the weekend demand, this profit-maximizing golf course should
A) charge $9 for each round, regardless of the day of the week.
B) charge $7 for each round, regardless of the day of the week.
C) charge $7 for each round on weekdays and $10 during the weekend.
D) charge $9 for each round on weekdays and $10 during the weekend.
Correct Answer:
Verified
Related Questions
Q327: Q328: Q329: Which of the following is not a Q330: Children are charged less than adults for![]()
![]()

