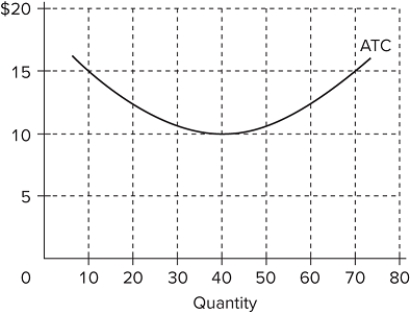
 The diagram shows the average total cost curve for a purely competitive firm. At the long-run equilibrium level of output, this firm's economic profit
A) is zero.
B) is $400.
C) is $200.
D) cannot be determined from the information provided.
Correct Answer:
Verified
Q100: Suppose a purely competitive, increasing-cost industry is
Q101: If a purely competitive constant-cost industry is
Q102: Suppose an increase in product demand occurs
Q103: Q104: A decreasing-cost industry is one in which Q106: The MR = MC rule applies Q107: Q108: Assume that a decline in consumer demand Q109: A purely competitive firm is precluded from Q110: Unlock this Answer For Free Now! View this answer and more for free by performing one of the following actions Scan the QR code to install the App and get 2 free unlocks Unlock quizzes for free by uploading documents![]()
A)contraction
A)in the![]()
![]()

