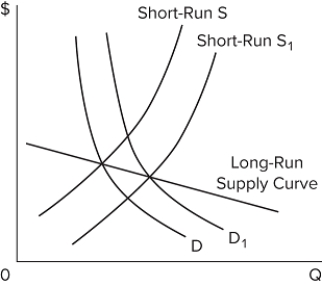
 The provided graph represents a(n)
A) decreasing-cost industry: Firms may be paying lower prices for their inputs when the industry expands.
B) increasing-cost industry: Firms may be paying higher prices for their inputs when the industry expands.
C) competitive industry with diseconomies of scale: The short-run supply curves are upward sloping.
D) constant-cost industry: Prices of the inputs stay the same, and other production costs are constant as the industry expands.
Correct Answer:
Verified
Q144: Which of the following statements is true
Q145: A long-run supply curve that is downward
Q146: Resources are efficiently allocated when production occurs
Q147: Q148: What happens in a decreasing-cost industry when Q150: A firm is producing an output such Q151: Assume a purely competitive decreasing-cost industry is Q152: If the price of product Y is Q153: Allocative efficiency is achieved when the production Q154: Which statement is correct? The long-run supply![]()
Unlock this Answer For Free Now!
View this answer and more for free by performing one of the following actions

Scan the QR code to install the App and get 2 free unlocks

Unlock quizzes for free by uploading documents