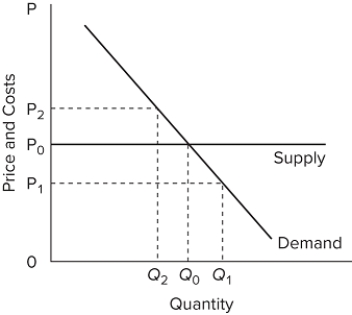
 The accompanying graph shows the long-run supply and demand curves in a purely competitive market. We know that in this market, the marginal
A) cost equals marginal benefit at P₁ Q₁.
B) benefit exceeds marginal cost at the output level of Q₂.
C) cost exceeds marginal benefit at the output level of Q₂.
D) benefit equals marginal cost at all points on the supply curve.
Correct Answer:
Verified
Q182: In long-run equilibrium, a purely competitive firm
Q183: Which would indicate that a firm is
Q184: Pure competition produces a socially optimal allocation
Q185: Q186: Allocative efficiency means that Q188: Resources are efficiently allocated when production occurs![]()
A)the product is produced
Unlock this Answer For Free Now!
View this answer and more for free by performing one of the following actions

Scan the QR code to install the App and get 2 free unlocks

Unlock quizzes for free by uploading documents