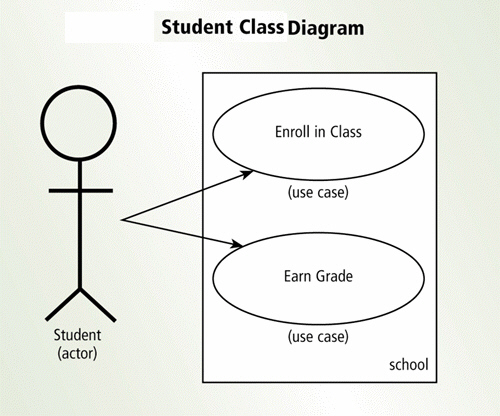
 As shown in the accompanying figure, a(n) ____________________ diagram graphically shows how actors interact with an information system.
Correct Answer:
Verified
Q165: On a data flow diagram, an arrow
Q166: In a diagram such as the one
Q167: Q170: Critical Thinking Questions Case 12-1 You have Q171: A top level DFD (data flow diagram) Q172: In an object, each data element is Q173: Critical Thinking Questions Case 12-2 In your Q174: Although used in all types of business Q188: Discuss the steps involved in acquiring hardware Q190: Define feasibility and explain the four tests![]()
Unlock this Answer For Free Now!
View this answer and more for free by performing one of the following actions

Scan the QR code to install the App and get 2 free unlocks

Unlock quizzes for free by uploading documents