FIGURE 2-3
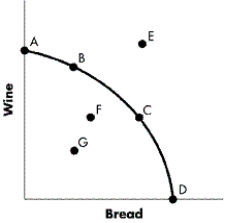
-Refer to Figure 2-3. An economy is operating at full employment, and then workers in the bread industry are laid off. How is this change portrayed on the production possibilities curve?
A) as a movement from A to B
B) as a movement from B to E
C) as a movement from C to F
D) as a movement from G to F
Correct Answer:
Verified
Q46: Using the production possibilities curve, which of
Q47: FIGURE 2-3 Q48: FIGURE 2-3 Q49: FIGURE 2-3 Q50: FIGURE 2-3 Q52: If additional units of output could be Q53: What is assumed when an economy's production Q54: Why is a production possibilities curve negatively Q55: Under what circumstances will an economy's production Q56: FIGURE 2-3 Unlock this Answer For Free Now! View this answer and more for free by performing one of the following actions Scan the QR code to install the App and get 2 free unlocks Unlock quizzes for free by uploading documents
![]()
![]()
![]()
![]()
![]()

