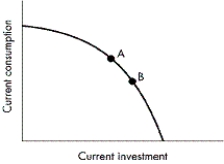
FIGURE 2-10

-Refer to Figure 2-10. Which of the following best explains how the society producing breadfruit and fish could have moved from curve AA to curve BB?
A) A new school of fish was located.
B) The society experienced significant immigration of labour.
C) The society reallocated its resources toward the production of a greater quantity of breadfruit.
D) The society reallocated its resources toward catching a greater number of fish.
Correct Answer:
Verified
Q86: What occurs with a movement in a
Q87: What does the law of increasing opportunity
Q88: Why is a production possibilities curve negatively
Q89: FIGURE 2-9 Q90: If an economy is operating inside its Q92: What is the main reason economists are Q93: Which of the following best describes what Q94: Which of the following is an illustration Q95: FIGURE 2-9 Q96: When does the law of increasing opportunity
![]()
![]()
Unlock this Answer For Free Now!
View this answer and more for free by performing one of the following actions

Scan the QR code to install the App and get 2 free unlocks

Unlock quizzes for free by uploading documents