FIGURE 2-12
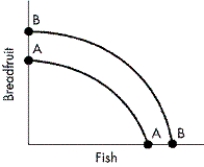
-Refer to Figure 2-12. Which of the following would most likely cause the production possibilities curve for breadfruit and fish to shift from AA to BB?
A) a decrease in the production of fish over breadfruit
B) a reduction in the size of the available labour force
C) an increase in the stock of capital
D) an increase in the production of fish over breadfruit
Correct Answer:
Verified
Q1: An improvement in technology will tend to
Q16: Capital accumulation causes the production possibilities curve
Q17: Any output combination outside the production possibilities
Q19: An increase in available resources will tend
Q135: High-wage countries like Canada tend to use
Q136: If the economy of Taiwan is growing
Q137: Capital-intensive production techniques tend to be utilized
Q138: What effect will improving the level of
Q139: When more resources in an economy are
Q145: High economic growth can eventually eliminate the
Unlock this Answer For Free Now!
View this answer and more for free by performing one of the following actions

Scan the QR code to install the App and get 2 free unlocks

Unlock quizzes for free by uploading documents