FIGURE 2-13
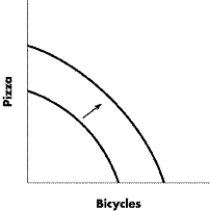
-Refer to Figure 2-13. Which of the following is a possible explanation for the shift of the production possibilities curve illustrated above?
A) an increase in the number of idle factories
B) a technological advance that affects both pizza and bicycle production
C) a decrease in the quantity of labour available due to emigration
D) a technological advance that affects only bicycle production
Correct Answer:
Verified
Q10: In a market economy, prices help determine
Q14: In a market economy, government officials make
Q116: Which of the following will shift the
Q117: Which of the following will NOT shift
Q118: The leader of a federal political party
Q119: How can a decrease in the unemployment
Unlock this Answer For Free Now!
View this answer and more for free by performing one of the following actions

Scan the QR code to install the App and get 2 free unlocks

Unlock quizzes for free by uploading documents