Multiple Choice
The diagram below represents the market for butter.
FIGURE 4-1
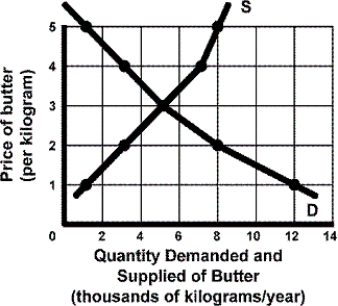
-Refer to Figure 4-1. What is the equilibrium price of butter?
A) $1
B) $2
C) $3
D) $5
Correct Answer:
Verified
Related Questions
Q5: TABLE 4-2 Q6: The diagram below represents the market for Q7: TABLE 4-2 Q8: Which of the following will result at Q9: The diagram below represents the market for Unlock this Answer For Free Now! View this answer and more for free by performing one of the following actions Scan the QR code to install the App and get 2 free unlocks Unlock quizzes for free by uploading documents
![]()
![]()

