Multiple Choice
The diagram below represents the market for butter.
FIGURE 4-1
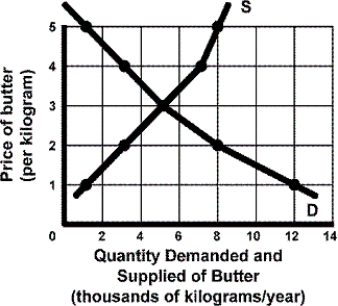
-Refer to Figure 4-1. What is the shortage or surplus that exists at a market price of $4?
A) a shortage exists equal to 4000 kilograms of butter
B) a surplus equal to 4000 kilograms of butter
C) a surplus equal to 7000 kilograms of butter
D) a shortage equal to 7000 kilograms of butter
Correct Answer:
Verified
Related Questions
Q11: TABLE 4-2 Q12: TABLE 4-2 Q13: What is occurring in the market when Q14: The diagram below represents the market for Q15: The diagram below represents the market for
![]()
![]()

