The diagram below represents the market for butter.
FIGURE 4-1
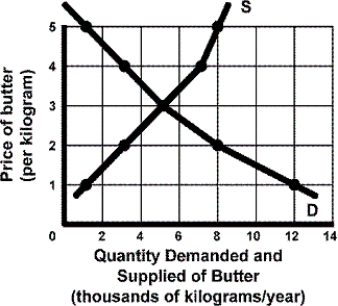
-Refer to Figure 4-1. If a price ceiling of $4 is imposed, how many units of butter will be sold?
A) 3000
B) 4000
C) 5000
D) 7000
Correct Answer:
Verified
Q1: TABLE 4-2 Q2: Which of the following statements describes equilibrium Q3: What will occur in the market when Q4: At the current market price for milk, Q5: TABLE 4-2 Q7: TABLE 4-2 Q8: Which of the following will result at Q9: The diagram below represents the market for Q10: The diagram below represents the market for Q11: TABLE 4-2 Unlock this Answer For Free Now! View this answer and more for free by performing one of the following actions Scan the QR code to install the App and get 2 free unlocks Unlock quizzes for free by uploading documents
![]()
![]()
![]()
![]()

