FIGURE 4-2
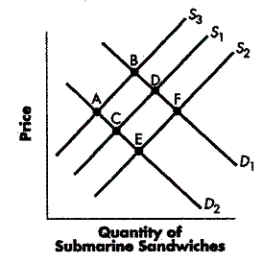
-Refer to Figure 4-2. Which movement of equilibrium illustrates an increase in the quantity supplied, but NOT an increase in supply?
A) from Point B to Point D
B) from Point D to Point C
C) from Point D to Point B
D) from Point C to Point D
Correct Answer:
Verified
Q51: In September 2005, Hurricane Katrina, caused flood
Q52: If the price of ice cream increases
Q53: FIGURE 4-2 Q54: If an effective rent ceiling is implemented, Q55: FIGURE 4-2 Q57: Good A (an inferior good) and Good Q58: What could explain an increase in the Q59: If Canadian consumers decided to boycott grapes Q60: Ceteris paribus, if the market demand for Q61: FIGURE 4-3 Unlock this Answer For Free Now! View this answer and more for free by performing one of the following actions Scan the QR code to install the App and get 2 free unlocks Unlock quizzes for free by uploading documents
![]()
![]()
![]()

