You are writing your yearly report for the sales company you work for, which has two sales teams. You have created a chart that shows the quarterly breakdown of each team's 2013 sales. 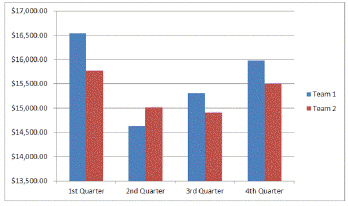
How could you make the chart look more attractive?
Correct Answer:
Verified
View Answer
Unlock this answer now
Get Access to more Verified Answers free of charge
Q48: Use the Chart button in the _
Q49: You can drag a(n) _ to modify
Q50: You create WordArt using the WordArt button
Q51: Match each pointer with a statement below.
Q52: Q54: What are shapes in Word and how Q55: Press _ and drag a corner sizing Q56: When a bitmap graphic is first inserted Q57: Nonprinting _ appear in Print Layout view Q58: ![]()
![]()
Unlock this Answer For Free Now!
View this answer and more for free by performing one of the following actions

Scan the QR code to install the App and get 2 free unlocks

Unlock quizzes for free by uploading documents