Multiple Choice
FIGURE 8-4
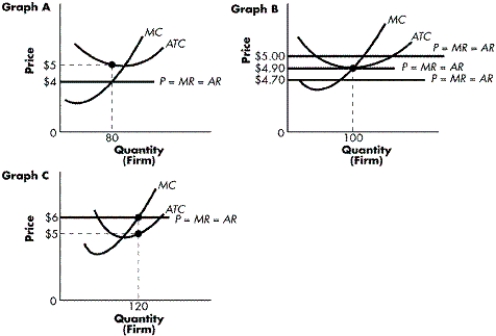
-Refer to Figure 8-4. What does Graph A illustrate?
A) a price-taking firm making a profit of $400
B) a price-taking firm making a profit of $80
C) a price-taking firm experiencing a loss of $400
D) a price-taking firm experiencing a loss of $80
Correct Answer:
Verified
Related Questions
Q54: TABLE 8-1 Q55: TABLE 8-1 Q56: When the marginal cost of a price-taking Q57: If a profit-maximizing firm finds that price
![]()
![]()

