Multiple Choice
FIGURE 8-4
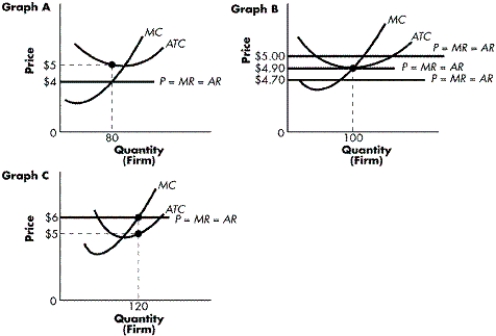
-Refer to Figure 8-4. What does Graph B illustrate?
A) a price-taking firm that will lose money when the market price equals $4.90
B) a price-taking firm that will break even when the market price equals $4.90
C) a price-taking firm that will shut down when the market price equals $4.90
D) a price-taking firm that will make an economic profit when the market price equals $4.90
Correct Answer:
Verified
Related Questions

