FIGURE 10-2 -The Profit-Maximizing Firm Illustrated Figure 10-2 Operates in a Monopolistically
FIGURE 10-2
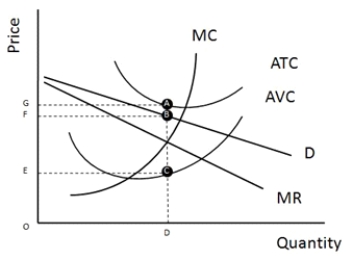
-The profit-maximizing firm illustrated Figure 10-2 operates in a monopolistically competitive industry. Which of the following best explains what happens in the long run?
A) New firms enter the industry, and the firm's demand curve shifts left and becomes more elastic.
B) Existing firms exit the industry, and the demand curves for the remaining firms shift right, increasing prices.
C) Some firms exit the industry and the firm's marginal cost curve shifts up, which leads to a decrease in the firm's output.
D) The market supply curve shifts left, increasing the equilibrium market price.
Correct Answer:
Verified
Q26: FIGURE 10-2 Q27: When does excess capacity in an industry Q28: FIGURE 10-2 Q29: FIGURE 10-2 Q30: What would regulating monopolistically competitive firms to Q32: What is monopolistic competition characterized by? Q33: What is the biggest difference between monopoly Unlock this Answer For Free Now! View this answer and more for free by performing one of the following actions Scan the QR code to install the App and get 2 free unlocks Unlock quizzes for free by uploading documents
![]()
![]()
![]()
A) too

