Multiple Choice
FIGURE 12-2
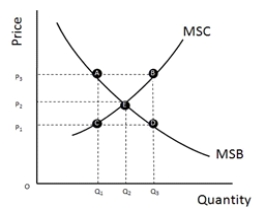
-Refer to Figure 12-2, which represents the costs and benefits of pollution control. What is the optimal amount of pollution control?
A) 0
B) Q1
C) Q2
D) Q3
Correct Answer:
Verified
Related Questions
Q32: FIGURE 12-2 Q33: The presence of a negative externality such Q34: The socially optimal level of pollution is Q35: Which of the following is NOT one Q36: An externality exists when an individual other Unlock this Answer For Free Now! View this answer and more for free by performing one of the following actions Scan the QR code to install the App and get 2 free unlocks Unlock quizzes for free by uploading documents
![]()

