What type of graph depicts the data below? 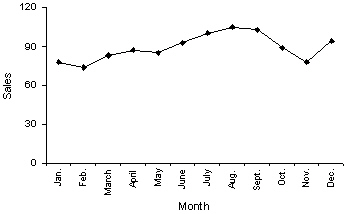
A) A line chart
B) A histogram
C) A dot plot
D) A bar chart
Correct Answer:
Verified
Q38: What does the length of each line
Q40: What values are displayed on a cumulative
Q61: Observations that are measured at the same
Q77: Time-series data are often graphically depicted how?
A)Bar
Q79: What kind(s)of data can be depicted by
Q80: Which of the following represents time-series data?
A)The
Q81: How do you determine whether two interval
Q94: Compare the spread of the two histograms
Q95: The relationship between two interval variables is
Q100: Compare the two histograms below. Which statement
Unlock this Answer For Free Now!
View this answer and more for free by performing one of the following actions

Scan the QR code to install the App and get 2 free unlocks

Unlock quizzes for free by uploading documents