Which of the following statements describe(s) the line chart below? 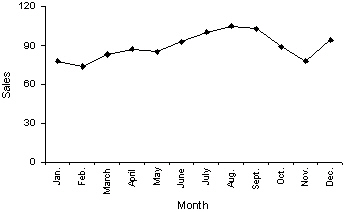
A) November experienced the lowest sales throughout the year.
B) August experienced the highest sales throughout the year.
C) Sales did not fluctuate more than 30 units on either side of 90.
D) All of these choices are true.
Correct Answer:
Verified
Q6: A researcher wishes to estimate the textbook
Q13: For which type of data are the
Q20: All calculations are permitted on what type
Q21: Which of the following statements about pie
Q24: Which of the following statements about shapes
Q28: Which of the following is true about
Q31: A modal class in a histogram is
Q32: The sum of the relative frequencies for
Q70: Observations that are measured at successive points
Q87: In order to draw a scatter diagram,we
Unlock this Answer For Free Now!
View this answer and more for free by performing one of the following actions

Scan the QR code to install the App and get 2 free unlocks

Unlock quizzes for free by uploading documents