Business School Graduates A sample of business school graduates were asked what their major was. The results are shown in the following frequency distribution. 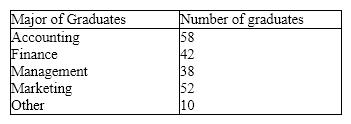 {Business School Graduates Narrative} Draw a pie chart of this data. Are you able to reconstruct the original data from this pie chart alone?
Correct Answer:
Verified
View Answer
Unlock this answer now
Get Access to more Verified Answers free of charge
Q42: {Test Grades Narrative} Describe the distribution of
Q43: {Test Grade Narrative} Construct a relative frequency
Q62: Briefly discuss the difference between cross-sectional data
Q68: Explain the difference between a histogram and
Q74: Test scores
The scores on a calculus
Q173: {Business School Graduates Narrative} If you were
Q174: Business School Graduates A sample of business
Q176: Insurance Company A representative from a local
Q177: Test Grades The scores on a calculus
Q183: Electronics Company At a meeting of regional
Unlock this Answer For Free Now!
View this answer and more for free by performing one of the following actions

Scan the QR code to install the App and get 2 free unlocks

Unlock quizzes for free by uploading documents