Suppose you measure the number of minutes it takes an employee to complete a task, where the maximum allowed time is 5 minutes, and each time is rounded to the nearest minute. Data from 130 employees is summarized below. Construct a frequency bar chart and a pie chart from this data. How long did it take most employees to complete the task? 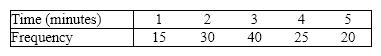
Correct Answer:
Verified
View Answer
Unlock this answer now
Get Access to more Verified Answers free of charge
Q32: Provide one example of ordinal data; one
Q35: For what type of data is a
Q44: {Test Grades Narrative} Construct frequency and relative
Q45: Teachers Ages
The ages (in years)of a
Q101: An individual's income depends somewhat on their
Q108: NARRBEGIN: Home Care
Home Care
Data are collected on
Q166: A supermarket's monthly sales (in thousands of
Q167: Consider the following cumulative frequency distribution.
Q168: Teachers Ages The ages (in years)of a
Q169: Forty truck buyers were asked to indicate
Unlock this Answer For Free Now!
View this answer and more for free by performing one of the following actions

Scan the QR code to install the App and get 2 free unlocks

Unlock quizzes for free by uploading documents