The number of houses sold in Miami Springs and the average monthly mortgage rates for 18 months randomly selected between January 2011 and April 2013 are shown in the following table.
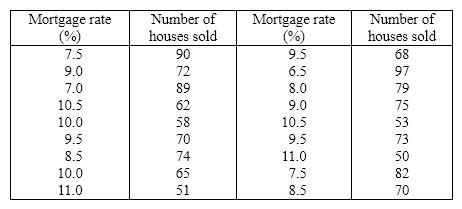
a. Draw a scatter diagram with the number of houses sold on the vertical axis.
b. Describe the relationship between mortgage rate and number of houses sold.
Correct Answer:
Verified
b. There is a strong neg...
View Answer
Unlock this answer now
Get Access to more Verified Answers free of charge
Q42: {Test Grades Narrative} Describe the distribution of
Q62: Briefly discuss the difference between cross-sectional data
Q68: Explain the difference between a histogram and
Q74: Test scores
The scores on a calculus
Q114: What are the two most important characteristics
Q183: Electronics Company At a meeting of regional
Q186: Electronics Company At a meeting of regional
Q187: Insurance Company A representative from a local
Q188: Internet Classes A survey of 25 students
Q189: Insurance Company A representative from a local
Unlock this Answer For Free Now!
View this answer and more for free by performing one of the following actions

Scan the QR code to install the App and get 2 free unlocks

Unlock quizzes for free by uploading documents