Ages of Workers The ages (in years)of three groups of workers are shown below: 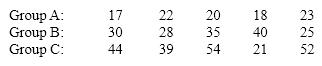 {Ages of Workers Narrative} Compute and compare the coefficient of variation for the three samples.
Correct Answer:
Verified
View Answer
Unlock this answer now
Get Access to more Verified Answers free of charge
Q102: Is it possible for the standard deviation
Q109: The following data represent the number of
Q137: Suppose your data set contains ages (in
Q138: The number of hours a college student
Q171: Ages of Volunteers The following data represent
Q172: Salaries of Office Workers The following data
Q173: Weights of Teachers The following data represent
Q174: Weights of Teachers The following data represent
Q177: Ages of Volunteers The following data represent
Q179: Salaries of Office Workers The following data
Unlock this Answer For Free Now!
View this answer and more for free by performing one of the following actions

Scan the QR code to install the App and get 2 free unlocks

Unlock quizzes for free by uploading documents