Consider a multinomial experiment involving 160 trials 4 categories (cells). The observed frequencies resulting from the experiment are shown in the accompanying table. 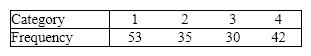 Use the 10% significance level to test the hypotheses: H 0: p 1 = p 2 = p 3 = p 4 = 0.25 vs. H 1: At least two proportions differ from their specified values.
Correct Answer:
Verified
View Answer
Unlock this answer now
Get Access to more Verified Answers free of charge
Q44: In 2011,the student body of a state
Q46: Five types of apples are displayed side
Q53: Explain what is meant by the rule
Q56: A calculus professor posted the following grade
Q81: The expected values of a contingency table
Q84: A Deli proposes to serve 4 main
Q86: Student Absenteeism Consider a multinomial experiment involving
Q86: The number of degrees of freedom associated
Q102: A large value of a chi-squared test
Q119: A chi-squared test of a contingency table
Unlock this Answer For Free Now!
View this answer and more for free by performing one of the following actions

Scan the QR code to install the App and get 2 free unlocks

Unlock quizzes for free by uploading documents