Life Expectancy An actuary wanted to develop a model to predict how long individuals will live. After consulting a number of physicians, she collected the age at death ( y ), the average number of hours of exercise per week ( x 1), the cholesterol level ( x 2), and the number of points that the individual's blood pressure exceeded the recommended value ( x 3). A random sample of 40 individuals was selected. The computer output of the multiple regression model is shown below. THE REGRESSION EQUATION IS y = 55.8 + 1.79 x 1 - 0.021 x 2 - 0.061 x 3 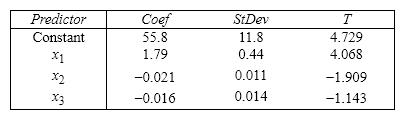
S = 9.47 R - Sq = 22.5%
ANALYSIS OF VARIANCE 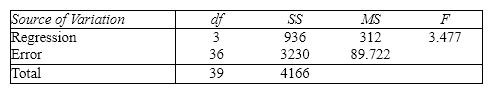 {Life Expectancy Narrative} Is there enough evidence at the 5% significance level to infer that the cholesterol level and the age at death are negatively linearly related?
Correct Answer:
Verified
View Answer
Unlock this answer now
Get Access to more Verified Answers free of charge
Q67: Consider the following statistics of a multiple
Q113: Student's Final Grade A statistics professor investigated
Q114: Life Expectancy An actuary wanted to develop
Q115: Life Expectancy An actuary wanted to develop
Q117: Student's Final Grade A statistics professor investigated
Q119: Life Expectancy An actuary wanted to develop
Q120: The computer output for the multiple regression
Q121: Real Estate Builder A real estate builder
Q122: Student's Final Grade A statistics professor investigated
Q123: Student's Final Grade A statistics professor investigated
Unlock this Answer For Free Now!
View this answer and more for free by performing one of the following actions

Scan the QR code to install the App and get 2 free unlocks

Unlock quizzes for free by uploading documents