Exhibit 1A-9 Multi-curve graph 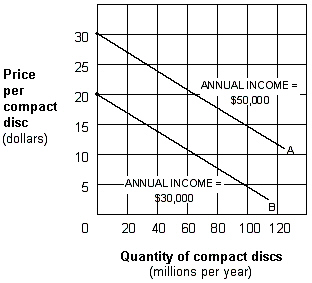 Exhibit 1A-9 represents a three-variable relationship. As the annual income of consumers falls from $50,000 (line A) to $30,000 (line B) , the result is a:
A) rightward movement along each curve.
B) leftward movement along each curve,.
C) leftward shift in curve A to curve B.
D) rightward shift in curve A to curve B.
Correct Answer:
Verified
Q10: Graphically express a direct and an inverse
Q40: A shift in a curve represents a
Q53: Exhibit 1A-6 Straight line Q55: Exhibit 1A-6 Straight line Q59: Exhibit 1A-7 Straight line relationship Q231: Direct relationships are illustrated using upward-sloping lines Q243: Two variables that are inversely related tend Q244: The slope of a line is calculated Q247: An upward-sloping straight line exhibits a direct Q251: If two variables are inversely related, then![]()
![]()

Unlock this Answer For Free Now!
View this answer and more for free by performing one of the following actions

Scan the QR code to install the App and get 2 free unlocks

Unlock quizzes for free by uploading documents