Exhibit 2-5 Production possibilities curve 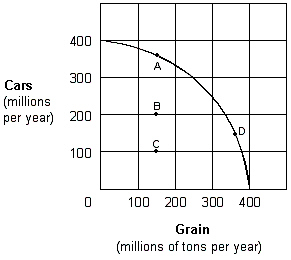 In Exhibit 2-5, movement between which of the following points represents an increase in economic efficiency?
A) A to C.
B) C to D.
C) D to B.
D) A to B.
E) A to D.
Correct Answer:
Verified
Q62: The law of increasing opportunity costs causes
Q63: The production possibilities curve demonstrates the basic
Q68: The production possibilities curve shows different combinations
Q80: The production possibility curve is bowed outward
Q81: Exhibit 2-4 Production possibilities curve data
Q81: All points on the production possibilities curve
Q83: If society leaves some of its resources
Q87: Any point inside the production possibility curve
Q95: A point inside a production possibilities curve
Q96: Along a production possibilities curve showing capital
Unlock this Answer For Free Now!
View this answer and more for free by performing one of the following actions

Scan the QR code to install the App and get 2 free unlocks

Unlock quizzes for free by uploading documents