Exhibit 2-6 Production possibilities curve data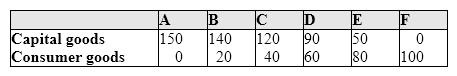 In Exhibit 2-6, the concept of increasing opportunity costs is represented by the fact that:
A) the quantity of capital goods produced must be less than 150.
B) the quantity of consumer goods is constant for each change in the quantity of capital goods produced.
C) greater amounts of capital goods must be sacrificed to produce each additional unit of consumer goods.
D) the amount of consumer goods produced must be greater than zero.
Correct Answer:
Verified
Q59: Which of the following would be most
Q79: As production of a good increases, opportunity
Q86: Given a production possibilities curve, a point:
A)
Q89: Exhibit 2-7 Production possibilities curve 
Q91: Exhibit 2-3 Production possibilities curve data
Q92: A point outside a production possibilities curve
Q96: Exhibit 2-8 Production possibilities curve data
Q98: Using a production possibilities curve, an economy
Q99: Exhibit 2-7 Production possibilities curve
Q100: One of the assumptions underlying the production
Unlock this Answer For Free Now!
View this answer and more for free by performing one of the following actions

Scan the QR code to install the App and get 2 free unlocks

Unlock quizzes for free by uploading documents