Exhibit 2-8 Production possibilities curve data 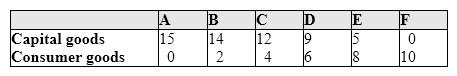 As shown in Exhibit 2-8, a total output of 0 units of capital goods and 10 units of consumer goods is:
A) the maximum rate of output for this economy.
B) an inefficient way of using the economy's scarce resources.
C) the result of maximum use of the economy's labor force.
D) unobtainable in this economy.
Correct Answer:
Verified
Q109: Exhibit 2-11 Production possibilities curves 
Q110: Exhibit 2-12 Production possibilities curve
Q111: Exhibit 2-13 Production possibilities curve
Q112: Exhibit 2-14 Production possibilities curve
Q113: Exhibit 2-10 Production possibilities curve data
Q115: Exhibit 2-13 Production possibilities curve
Q116: Exhibit 2-9 Production possibilities curve
Q117: Exhibit 2-10 Production possibilities curve data
Q118: Exhibit 2-8 Production possibilities curve data
Q119: Exhibit 2-10 Production possibilities curve data
Unlock this Answer For Free Now!
View this answer and more for free by performing one of the following actions

Scan the QR code to install the App and get 2 free unlocks

Unlock quizzes for free by uploading documents