Exhibit 3A-2 Comparison of Market Efficiency and Deadweight Loss 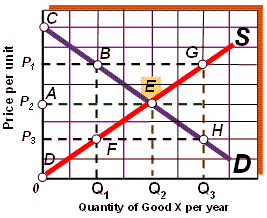 As shown in Exhibit 3A-2, if the quantity supplied of good X per year is Q3, the result is:
A) deadweight loss.
B) inefficiency.
C) overproduction.
D) all of the above are true.
E) none of the above are true.
Correct Answer:
Verified
Q55: Exhibit 3A-1 Comparison of Market Efficiency and
Q56: Exhibit 3A-1 Comparison of Market Efficiency and
Q57: Exhibit 3A-1 Comparison of Market Efficiency and
Q59: Exhibit 3A-2 Comparison of Market Efficiency and
Q401: Producer surplus measures the value between the
Q403: The deadweight loss equals the consumer surplus
Q404: The points along the supply curve represent
Q408: Total producer surplus is measured by the
Q410: At the equilibrium price, deadweight loss is
Q412: Consumer surplus measures the value between the
Unlock this Answer For Free Now!
View this answer and more for free by performing one of the following actions

Scan the QR code to install the App and get 2 free unlocks

Unlock quizzes for free by uploading documents