Exhibit 3-3 Demand curves 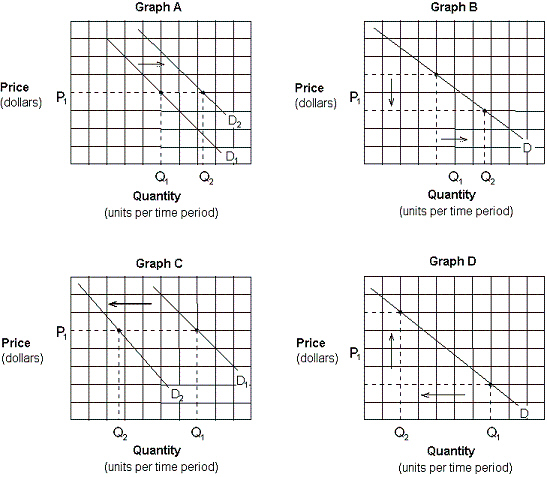 Which of the graphs in Exhibit 3-3 depicts the effect of an increase in income on the demand for DVDs (a normal good) ?
A) Graph A.
B) Graph B.
C) Graph C.
D) Graph D.
Correct Answer:
Verified
Q67: Supply curves slope upward because:
A) the quality
Q72: Which of the following states the definition
Q77: The law of supply states that:
A) there
Q163: A supply schedule shows the relationship between:
A)
Q174: There is news that the price of
Q176: According to the law of supply, there
Q177: The supply schedule shows the specific quantity
Q178: Exhibit 3-3 Demand curves Q180: Assume that peanut butter and jelly are Q284: According to the law of supply,![]()
A) more
Unlock this Answer For Free Now!
View this answer and more for free by performing one of the following actions

Scan the QR code to install the App and get 2 free unlocks

Unlock quizzes for free by uploading documents