Exhibit 3-7 Demand and supply curves 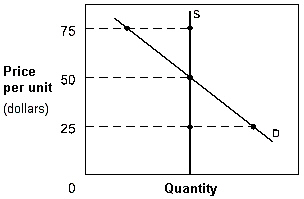 In Exhibit 3-7, if price happened to currently be $75 in this market, a ____ would result, causing a(n) ____ in price.
A) shortage; increase
B) shortage; decrease
C) surplus; increase
D) surplus; decrease
E) market clearing; change
Correct Answer:
Verified
Q255: Which of the following best explains
Q258: The equilibrium price is best defined as
Q266: When the price of a good in
Q267: Market equilibrium is:
A)defined as the condition in
Q268: Exhibit 3-8 Demand and supply data for
Q268: At any price below the equilibrium
Q269: Exhibit 3-8 Demand and supply data for
Q270: Exhibit 3-8 Demand and supply data for
Q272: Exhibit 3-6 Milk market Q273: Exhibit 3-8 Demand and supply data for![]()
Unlock this Answer For Free Now!
View this answer and more for free by performing one of the following actions

Scan the QR code to install the App and get 2 free unlocks

Unlock quizzes for free by uploading documents