Exhibit 3-10 Demand and supply curves 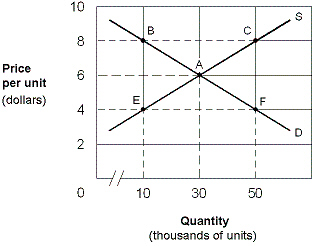 In Exhibit 3-10, which of the following points represents an excess quantity supplied?
A) Point E.
B) Point B.
C) Point C.
D) Point F.
E) Point A.
Correct Answer:
Verified
Q288: Exhibit 3-15 Supply and demand curves for
Q289: Exhibit 3-12 Supply and demand data
Q290: Exhibit 3-11 Demand and supply curves
Q291: Exhibit 3-14 Supply and demand curves
Q292: Exhibit 3-10 Demand and supply curves
Q294: Exhibit 3-13 Supply and demand curves
Q295: Exhibit 3-15 Supply and demand curves for
Q296: Exhibit 3-9 Demand and supply curves
Q297: Exhibit 3-12 Supply and demand data
Q298: Exhibit 3-11 Demand and supply curves
Unlock this Answer For Free Now!
View this answer and more for free by performing one of the following actions

Scan the QR code to install the App and get 2 free unlocks

Unlock quizzes for free by uploading documents