Exhibit 3-15 Supply and demand curves for good X 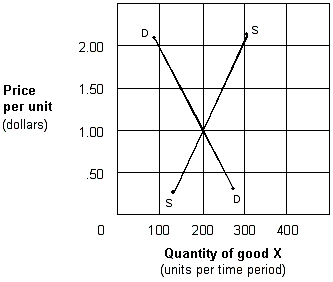 In the market shown in Exhibit 3-15, the equilibrium price and quantity of good X are:
A) $0.50, 250.
B) $2.00, 300.
C) $2.00, 100.
D) $1.00, 200.
Correct Answer:
Verified
Q301: If X and Y are substitutes, the
Q305: If pork and beans is an inferior
Q306: An increase in demand is reflected as
Q307: Demand curves slope downward to the right.
Q309: Other things being equal, an increase in
Q309: Exhibit 3-15 Supply and demand curves for
Q310: Higher milk prices reduce the demand for
Q311: Other things being equal, an increase in
Q316: Exhibit 3-16 Supply and demand curves for
Q317: Exhibit 3-15 Supply and demand curves for
Unlock this Answer For Free Now!
View this answer and more for free by performing one of the following actions

Scan the QR code to install the App and get 2 free unlocks

Unlock quizzes for free by uploading documents