Exhibit 4-3 Supply and demand curves 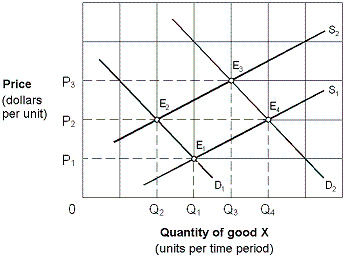 Initially the market shown in Exhibit 4-3 is in equilibrium at P3, Q3 (E3) . Changes in market conditions result in a new equilibrium at P2, Q2 (E2) . This change is stated as a:
A) decrease in demand and an increase in supply.
B) decrease in demand and a decrease in quantity supplied.
C) decrease in quantity demanded and an increase in quantity supplied.
D) decrease in quantity demanded and an increase in supply.
Correct Answer:
Verified
Q29: Which of the following would raise both
Q33: Consider the market for chicken. Assuming that
Q35: Exhibit 4-1 Supply and demand data
Q37: Exhibit 4-3 Supply and demand curves
Q38: Exhibit 4-3 Supply and demand curves
Q38: An increase in the price of plastic
Q39: Exhibit 4-2 Supply and demand curves
Q45: Exhibit 4-4 Supply and demand curves for
Q56: Which of the following statements is true
Q169: Which of the following is the best
Unlock this Answer For Free Now!
View this answer and more for free by performing one of the following actions

Scan the QR code to install the App and get 2 free unlocks

Unlock quizzes for free by uploading documents