Exhibit 4-4 Supply and demand curves for good X 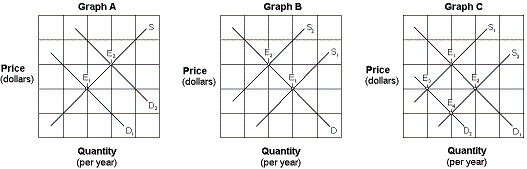 Which of the graphs in Exhibit 4-4 represents a decrease in the price of a factor of production?
A) Graph A.
B) Graph B.
C) Graph C.
D) None of these.
Correct Answer:
Verified
Q29: Which of the following would raise both
Q33: Consider the market for chicken. Assuming that
Q40: Exhibit 4-3 Supply and demand curves
Q47: Exhibit 4-3 Supply and demand curves
Q48: Exhibit 4-4 Supply and demand curves for
Q49: Exhibit 4-4 Supply and demand curves for
Q50: Exhibit 4-6 Demand and supply curves
Q55: If the cost of fertilizer rises, then
Q56: Which of the following statements is true
Q169: Which of the following is the best
Unlock this Answer For Free Now!
View this answer and more for free by performing one of the following actions

Scan the QR code to install the App and get 2 free unlocks

Unlock quizzes for free by uploading documents