Exhibit 4-4 Supply and demand curves for good X 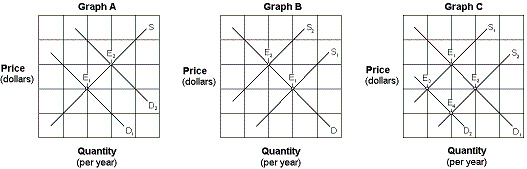 An increase in buyers' income, assuming good X is a normal good, combined with an increase in the wage rate paid to workers producing good X would be represented by which of the following changes in equilibrium shown in Graph C of Exhibit 4-4?
A) E1 to E2.
B) E1 to E3.
C) E3 to E2.
D) E4 to E1.
Correct Answer:
Verified
Q21: Suppose prices for new homes have risen,
Q49: Exhibit 4-4 Supply and demand curves for
Q50: Exhibit 4-6 Demand and supply curves
Q52: Exhibit 4-4 Supply and demand curves for
Q55: Exhibit 4-3 Supply and demand curves
Q56: Exhibit 4-4 Supply and demand curves for
Q57: Exhibit 4-6 Demand and supply curves
Q58: Exhibit 4-6 Demand and supply curves
Q59: Exhibit 4-5 Supply and demand curves for
Q67: An increase in consumers' incomes will have
Unlock this Answer For Free Now!
View this answer and more for free by performing one of the following actions

Scan the QR code to install the App and get 2 free unlocks

Unlock quizzes for free by uploading documents