Exhibit 4-8 Demand and supply curves 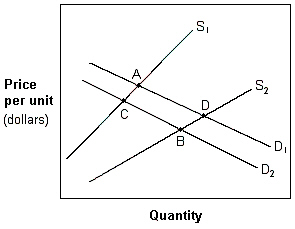 In Exhibit 4-8, a movement from A to D is best described as a(n) :
A) increase in the quantity demanded and an increase in supply.
B) increase in supply and demand.
C) increase in both the quantity demanded and supplied.
D) increase in the quantity supplied and in the demand.
E) decrease in the quantity demanded and a decrease in supply.
Correct Answer:
Verified
Q74: Ceteris paribus, an increase in the supply
Q75: Exhibit 4-8 Demand and supply curves
Q78: Exhibit 4-7 Demand and supply schedules for
Q80: Exhibit 4-8 Demand and supply curves
Q81: An example of a price ceiling would
Q82: Suppose a price ceiling is set by
Q84: Exhibit 4-9 Data on supply and demand
Q88: Many student government candidates at colleges and
Q90: If the equilibrium price of natural gas
Q98: If the government imposes a price ceiling,
Unlock this Answer For Free Now!
View this answer and more for free by performing one of the following actions

Scan the QR code to install the App and get 2 free unlocks

Unlock quizzes for free by uploading documents