Exhibit 4-8 Demand and supply curves 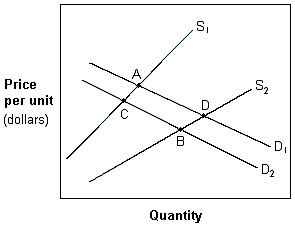 In Exhibit 4-8, a movement from A to B is best explained by:
A) an increase in income and in the number of suppliers.
B) an increase in the price of other goods.
C) an increase in the population.
D) a decrease in income and an improvement in the technology used to produce the good.
E) equilibrium quantity increases and the equilibrium price change is indeterminate.
Correct Answer:
Verified
Q45: There was an extensive black market (illegal
Q47: Rent control applies to about two-thirds of
Q57: Exhibit 4-6 Demand and supply curves
Q58: Exhibit 4-6 Demand and supply curves
Q59: Exhibit 4-5 Supply and demand curves for
Q60: Exhibit 4-6 Demand and supply curves
Q66: Exhibit 4-7 Demand and supply schedules for
Q68: An increase in the wages paid to
Q75: An increase in demand and a decrease
Q92: If the equilibrium price of aspirins is
Unlock this Answer For Free Now!
View this answer and more for free by performing one of the following actions

Scan the QR code to install the App and get 2 free unlocks

Unlock quizzes for free by uploading documents