Exhibit 4-8 Demand and supply curves 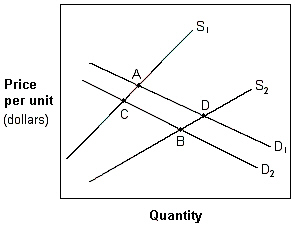 In Exhibit 4-8, a movement from A to B in which price has decreased and quantity has increased is best explained by a(n) :
A) increase in supply and demand.
B) decrease in supply and demand.
C) increase in supply that dominates a decrease in demand.
D) increase in demand that dominates a decrease supply.
E) decrease in demand that dominates an increase in supply.
Correct Answer:
Verified
Q64: An increase in both supply and demand
Q69: Suppose the market for "soda X" is
Q70: Ceteris paribus, if consumer tastes change so
Q74: Ceteris paribus, an increase in the supply
Q78: Exhibit 4-7 Demand and supply schedules for
Q79: Exhibit 4-8 Demand and supply curves
Q80: Exhibit 4-8 Demand and supply curves
Q88: Many student government candidates at colleges and
Q90: If the equilibrium price of natural gas
Q232: If a government imposed price ceiling legally
Unlock this Answer For Free Now!
View this answer and more for free by performing one of the following actions

Scan the QR code to install the App and get 2 free unlocks

Unlock quizzes for free by uploading documents