Exhibit 8-2 Consumption function 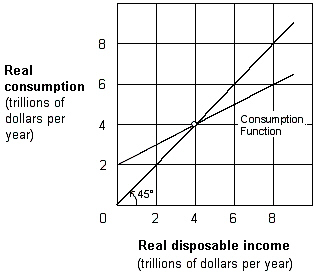 As shown in Exhibit 8-2, saving occurs:
A) at 0 disposable income.
B) between $0 and $4 trillion disposable income.
C) at $4 trillion disposable income.
D) at a disposable income greater than $4 trillion.
Correct Answer:
Verified
Q5: Mathematically, the marginal propensity to consume is
A)
Q45: The sum of the marginal propensity to
Q99: Use the table below to answer the
Q102: If the marginal propensity to consume =
Q103: As shown in Exhibit 8-2, dissaving occurs:
A)at
Q105: As shown in Exhibit 8-2, the break-even
Q106: As shown in Exhibit 8-2, the 45
Q107: If your disposable personal income increases from
Q108: The relationship between MPC and MPS is:
A)1
Q109: The marginal propensity to save (MPS)is computed
Unlock this Answer For Free Now!
View this answer and more for free by performing one of the following actions

Scan the QR code to install the App and get 2 free unlocks

Unlock quizzes for free by uploading documents