Exhibit 8-2 Consumption function 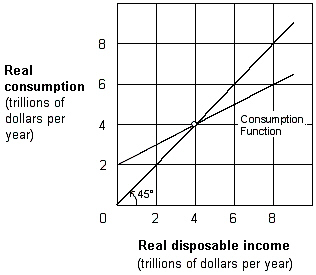 As shown in Exhibit 8-2, the marginal propensity to consume (MPC) is:
A) 0.25.
B) 0.50.
C) 0.75.
D) 0.90.
Correct Answer:
Verified
Q108: The relationship between MPC and MPS is:
A)1
Q109: The marginal propensity to save (MPS)is computed
Q110: Exhibit 8-2 Consumption function Q111: The marginal propensity to save is: Q112: Exhibit 8-3 Consumption Function Q114: As shown in Exhibit 8-3, autonomous consumption Q115: The change in saving divided by the Q116: Exhibit 8-1 Disposable income and consumption data Q117: Exhibit 8-1 Disposable income and consumption data Q118: Exhibit 8-2 Consumption function Unlock this Answer For Free Now! View this answer and more for free by performing one of the following actions Scan the QR code to install the App and get 2 free unlocks Unlock quizzes for free by uploading documents![]()
A)the change![]()
![]()

