Exhibit 8-4 Disposable income and consumption data 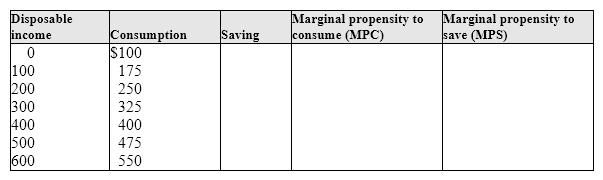
Note: All amounts are in billions of dollars per year. As shown in Exhibit 8-4, if disposable income is $100 billion, saving is:
A) $100 billion.
B) $75 billion.
C) - $75 billion.
D) - $175 billion.
Correct Answer:
Verified
Q80: An increase in the wealth of households,
Q126: As shown in Exhibit 8-3, dissaving occurs:
A)at
Q127: Exhibit 8-5 Consumption function Q128: A shift in the consumption function: Q129: Exhibit 8-4 Disposable income and consumption data Q130: Exhibit 8-5 Consumption function Q132: Exhibit 8-5 Consumption function Q133: Exhibit 8-4 Disposable income and consumption data Q134: As shown in Exhibit 8-3, the marginal Q136: Which of the following events would produce Unlock this Answer For Free Now! View this answer and more for free by performing one of the following actions Scan the QR code to install the App and get 2 free unlocks Unlock quizzes for free by uploading documents![]()
A)is based![]()
![]()

