Exhibit 8-4 Disposable income and consumption data 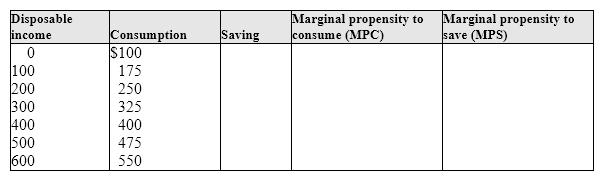
Note: All amounts are in billions of dollars per year. As shown in Exhibit 8-4, if disposable income is $600, saving is:
A) zero.
B) - $100 billion.
C) $100 billion.
D) - $50 billion.
E) $50 billion.
Correct Answer:
Verified
Q117: Exhibit 8-1 Disposable income and consumption data
Q118: Exhibit 8-2 Consumption function Q119: The marginal propensity to save is: Q120: As shown in Exhibit 8-3, saving occurs: Q121: Exhibit 8-4 Disposable income and consumption data Q123: Exhibit 8-4 Disposable income and consumption data Q124: An upward shift in the consumption function, Q125: As shown in Exhibit 8-3, break-even income Q126: As shown in Exhibit 8-3, dissaving occurs: Q127: Exhibit 8-5 Consumption function ![]()
A)the change
A)at
A)at![]()
Unlock this Answer For Free Now!
View this answer and more for free by performing one of the following actions

Scan the QR code to install the App and get 2 free unlocks

Unlock quizzes for free by uploading documents