Exhibit 10-4 Aggregate supply and demand curves 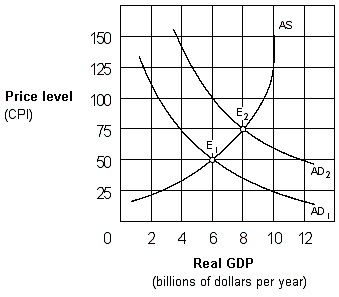 The increase in the price level as the economy moves from E1 to E2 in Exhibit 10-4 represents:
A) cost-push inflation.
B) demand-shock inflation.
C) wage push inflation.
D) demand-pull inflation.
Correct Answer:
Verified
Q143: The aggregate demand curve is downward sloping.
Q145: The aggregate demand curve slopes downward because
Q151: Exhibit 10-8 Aggregate demand and supply
Q152: Exhibit 10-8 Aggregate demand and supply
Q154: Exhibit 10-8 Aggregate demand and supply
Q157: Exhibit 10-7 Aggregate supply and demand curves
Q158: Exhibit 10-4 Aggregate supply and demand curves
Q159: Exhibit 10-7 Aggregate supply and demand curves
Q160: Exhibit 10-8 Aggregate demand and supply
Q176: The aggregate supply curve is horizontal in
Unlock this Answer For Free Now!
View this answer and more for free by performing one of the following actions

Scan the QR code to install the App and get 2 free unlocks

Unlock quizzes for free by uploading documents