Exhibit 10-5 Aggregate demand curves 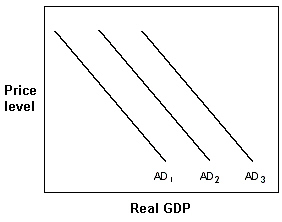 In Exhibit 10-5, which one of the following could cause the U.S. aggregate demand curve to move from AD3 to AD2?
A) Greater resource availability.
B) Nonfluctuating resource availability.
C) A recession in Japan.
D) An increase in government grants for AIDS awareness programs.
E) An expectation that future income will rise.
Correct Answer:
Verified
Q144: Exhibit 10-6 Aggregate supply curve 
Q145: Exhibit 10-8 Aggregate demand and supply
Q145: The aggregate demand curve slopes downward because
Q146: Exhibit 10-8 Aggregate demand and supply
Q147: Exhibit 10-8 Aggregate demand and supply
Q148: Exhibit 10-8 Aggregate demand and supply
Q150: Exhibit 10-6 Aggregate supply curve
Q151: Exhibit 10-8 Aggregate demand and supply
Q152: Exhibit 10-8 Aggregate demand and supply
Q154: Exhibit 10-8 Aggregate demand and supply
Unlock this Answer For Free Now!
View this answer and more for free by performing one of the following actions

Scan the QR code to install the App and get 2 free unlocks

Unlock quizzes for free by uploading documents